Journey to random animations in ArcGIS Pro
Introduction
Mapping tabulated data with a spatial component is always a good idea.
It combines our underlying knowledge about the territory with the available information
(not saying this could not work against us), easing the insight generation process.
The Ministry of Public Health and Social Assistance of the Dominican Republic
publishes daily data on new COVID-19 cases, cumulated cases, and more.
These are aggregated by province and available for download as xls files.
We decided to map them and see how the virus spread around the country while
keeping the temporal component. The latter would require creating a
dynamic map and publishing it as a video, a task I had not done before.
The steps carried out to get the map are described below. First, a few wrangling
steps were carried out using Pandas, and later, the mapping using ArcGIS PRO.
Data wrangling
- Excel: I visually inspected the Excel files first and then exported them to CSV for wrangling and cleaning using pandas.
- Pandas:
- Imported the CSV files to pandas, set up an encoding to recognize the 'ñ' letter, and created the data frame.
- Further inspection of the data using panda's functions: shape, info, head, tails, etc. With that inspection, the cleaning and tidying required by the data became evident.
- The cleaning process required the elimination of null values or invalid ones (e.g., negative values for positive cases). Some text data was cast to date type and int.
- The table shape did not comply with the ‘Tidy data’ requirements, as some observational units were columns and not rows. The dates were stored in columns instead of an attribute of each province. The table was reshaped from long format to wide using the ‘melt’ tool. After the transformation, the table became larger in rows but coherent with what ArcGIS and any other program would expect.
- As the names of the provinces did not include coordinates, these were added using the library Geocoder and the OpenStreetMap API. Before that, the country's name was concatenated with the provinces' names to avoid toponym confusion.
Animation in ArcGIS PRO
The CSV table was imported to ArcGIS Pro. The steps are described below:
- Import tables as a point feature class using from XYtotable.
- Download a Polygon layer with Dominican Republic provinces. This was done using the National Statistics Office (Dominican Republic) page. These two layers were joined spatially. The union was one to many.
- As the points were all located in the centroid of each polygon, the tool CreateRandom Points was used to map the cases within each polygon for each date. These points were created as separate points, not multipoints, and stored in a different feature class layer. This was then joined to the layer with the dates. Before that, the tool Dissolve was used to join them into multipoint (this option was not selected in the create random points tool because then points would lose their ID, and the union would not be possible).
- Go to layer properties and activate the time variable with the field storing the dates.
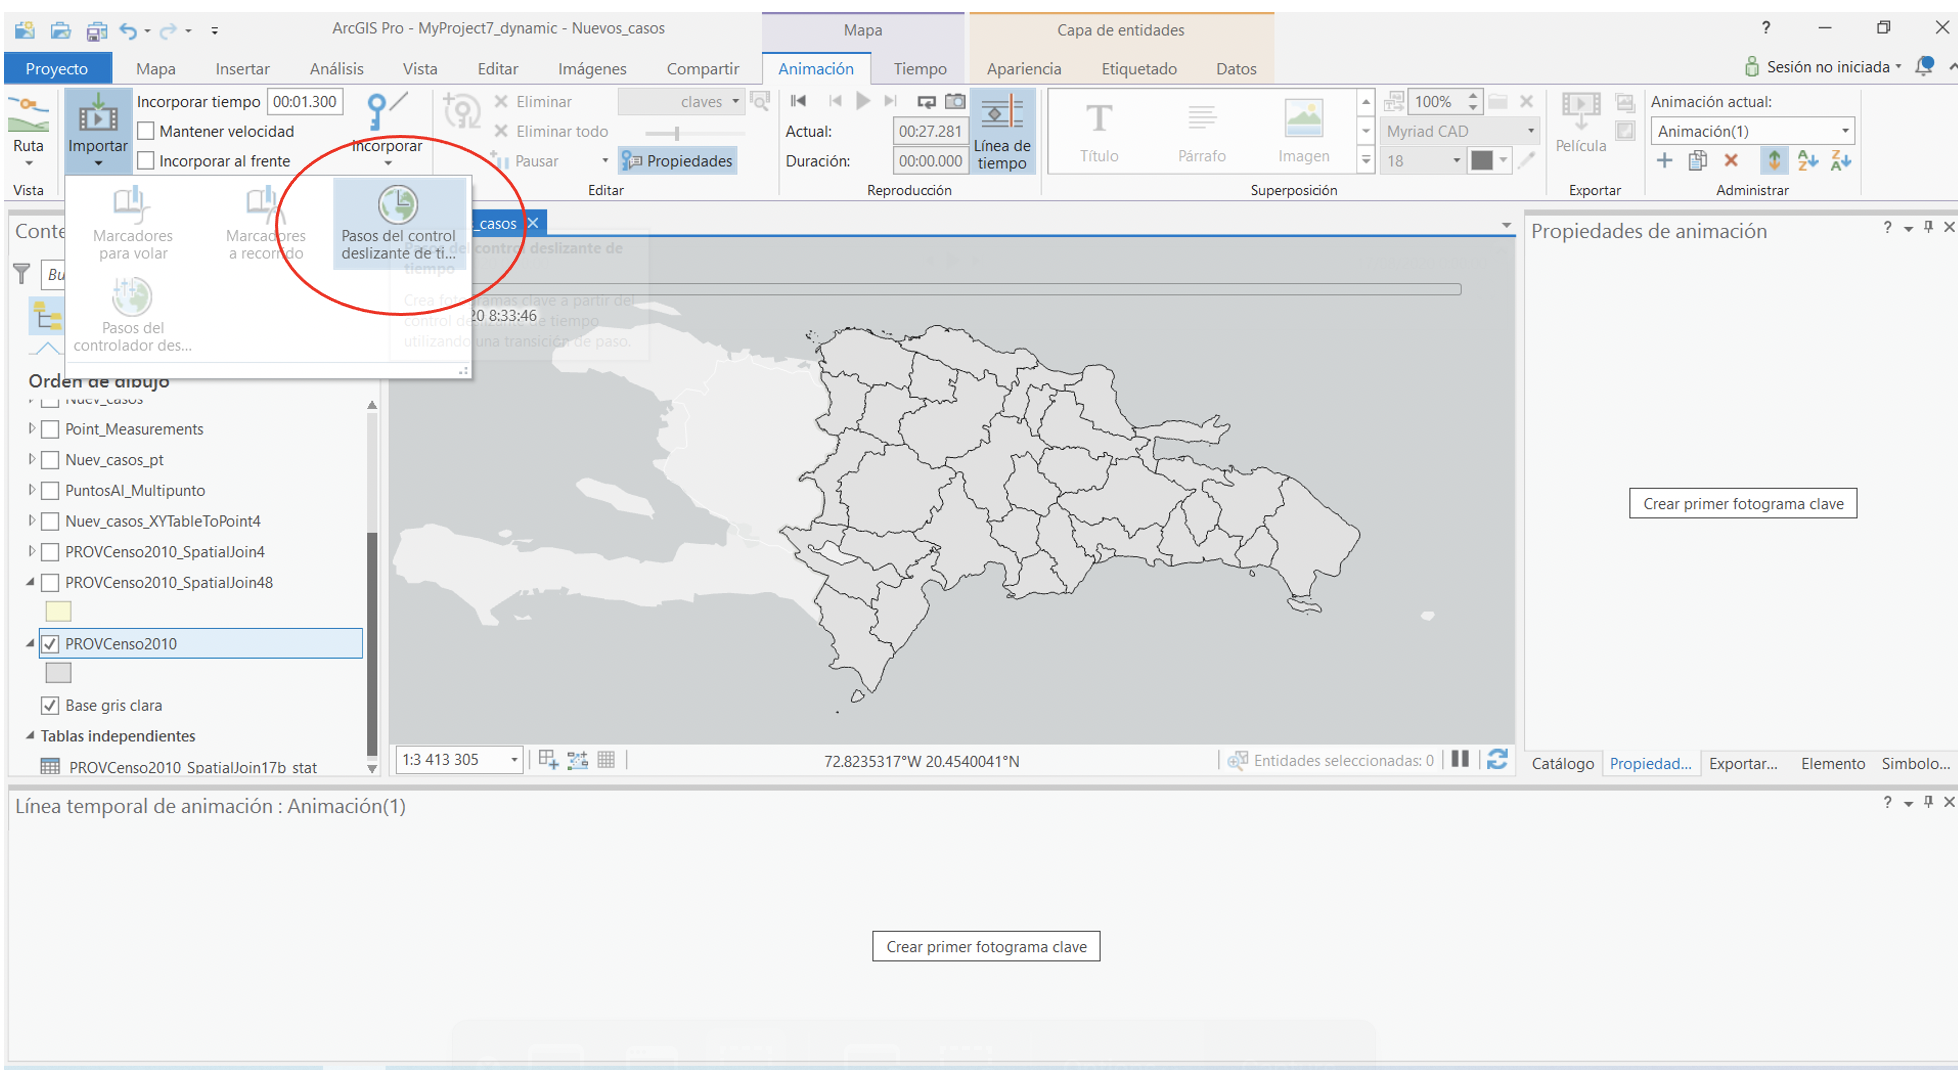
- Next was to create the animation. In the view Tab, animation group --> Create animation

This was my first time doing animations using ArcGIS PRO, and this is better explained with images:
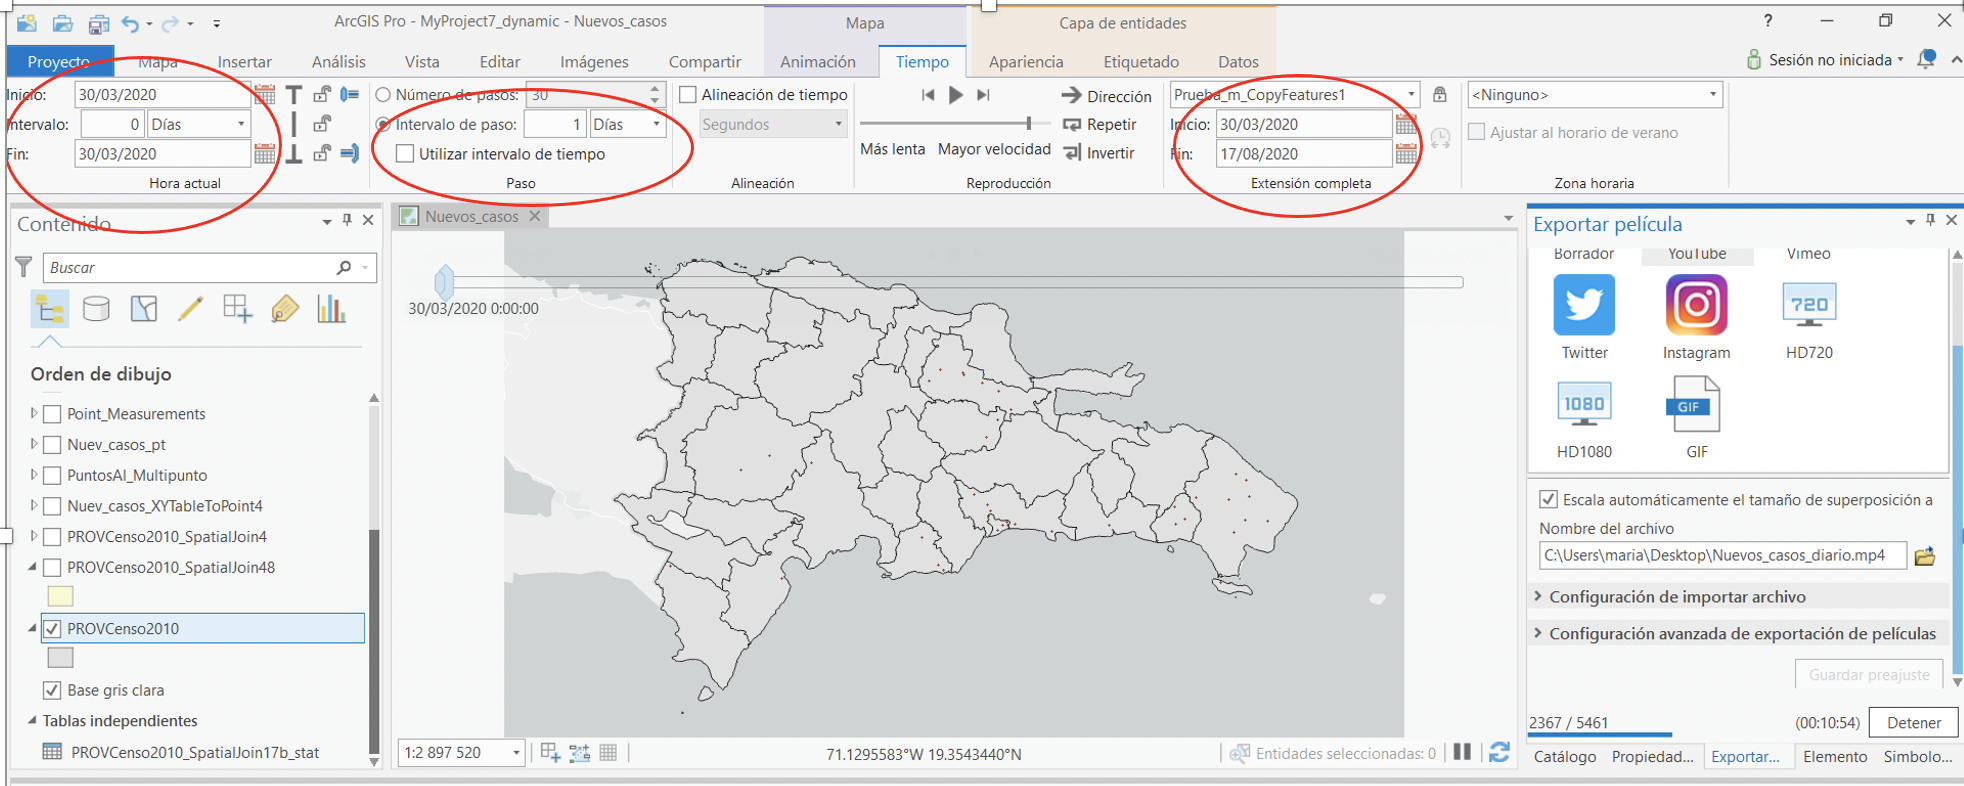
First verify that the time interval is the one intended (it should take them from the date field), then set the proper time step interval, this is used to configure the map's time slider (I used 1 second) and make sure the right layer is selected.
After adding the time slider one can configure what information is to be shown in the map. I decided to add dynamic text that displays the dates. After some more tweaking, the video is ready to be exported.